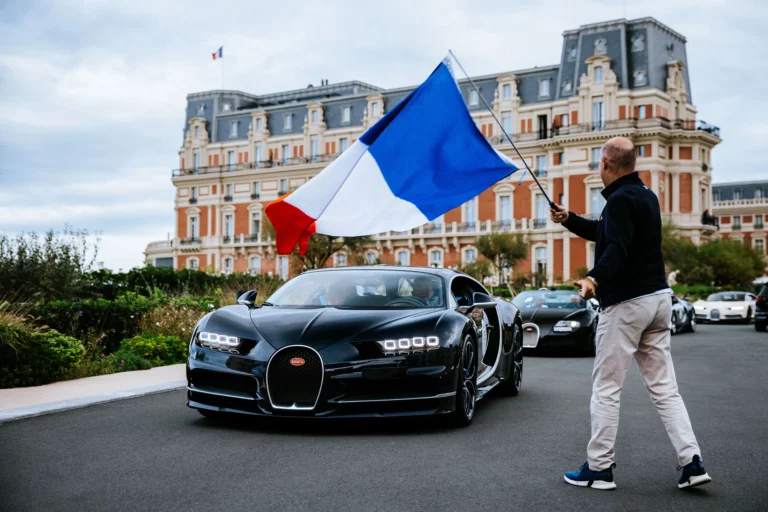
Biarritz pairs Atlantic surf culture with an increasingly distinctive motorcycle and custom-building scene. Its coastal setting and proximity to the Basque hills create compelling opportunities for riding, while gatherings such as Wheels and Waves bring machines, art and adventure together. The destination’s character is as much about creative freedom as the road itself.
Climate
Best time to visit · Jun–Sep
Temperature High / low °C
Daylight Hours a day
Rainfall 1,289 mm a year
Monthly averages for Biarritz, 1991–2020.
Best time to visit: when clear, rainless days between 18 and 27 °C are likeliest.
Generated using Copernicus Climate Change Service information 2026 (CC BY 4.0).
Neither the European Commission nor ECMWF is responsible for any use that may be made of the Copernicus information or data it contains.
| Month | High °C | Low °C | Rainfall mm | Rainy days | Daylight h |
|---|---|---|---|---|---|
| January | 11° | 6° | 128 | 15 | 9.4 |
| February | 12° | 6° | 111 | 14 | 10.5 |
| March | 14° | 7° | 103 | 14 | 12.0 |
| April | 16° | 9° | 112 | 15 | 13.5 |
| May | 19° | 12° | 101 | 14 | 14.7 |
| June | 21° | 15° | 81 | 12 | 15.4 |
| July | 23° | 17° | 70 | 12 | 15.0 |
| August | 24° | 18° | 71 | 12 | 13.9 |
| September | 22° | 16° | 92 | 12 | 12.5 |
| October | 19° | 13° | 118 | 14 | 11.0 |
| November | 15° | 9° | 166 | 15 | 9.7 |
| December | 12° | 7° | 138 | 15 | 9.0 |
Latest Stories
Places in Biarritz
-
This map is provided by Google Maps. Loading it may allow Google to store or access information on your device.